Hello All, Mobile applications are becoming more user-friendly and speedier while accessing or requesting services from the internet.
A great user interface that attracts end users is essential for successful mobile applications. But what if the app doesn’t work properly?
This is where Flutter UI profiling comes in and gives us tools to find performance and bottleneck issues in Flutter apps.
Before we begin profiling an app, it is important to learn a few key terms that are essential for UI profiling.
Come with us to put your idea into your dream application with our Flutter app development service.
Find the performance and bottleneck issues
We find how to find the performance and bottleneck issues in the Flutter apps and rectify the performance and bottleneck issue by following the below steps:-
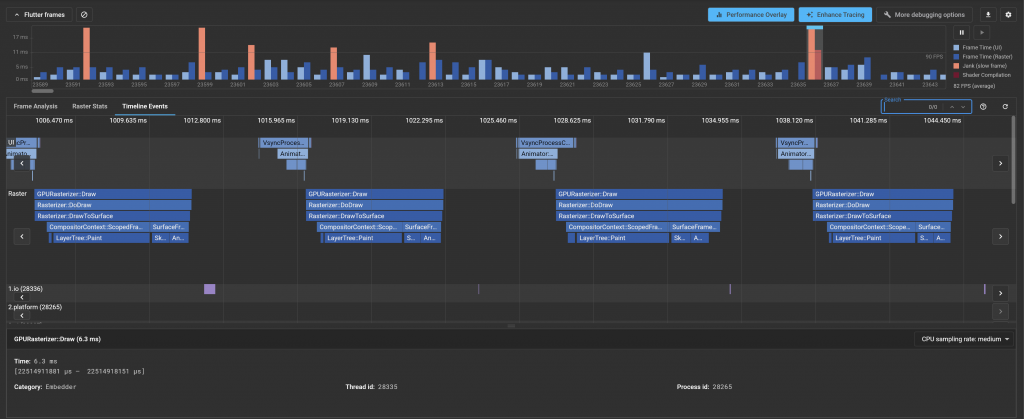
Profiling with Flutter DevTools
Flutter DevTools is a powerful tool that provides insights into your app’s performance. It has a built-in profiler that allows you to measure performance metrics such as frame rate, CPU usage, memory usage, and network activity.
You can use this information to identify and diagnose performance issues.
Flutter Performance Overlay
Flutter provides a performance overlay that displays information about the performance of your app directly on the device.
The overlay displays the current frame rate, GPU usage, and CPU usage. To enable the performance overlay, set the debugShowPerformanceOverlay flag to true in your app’s MaterialApp.

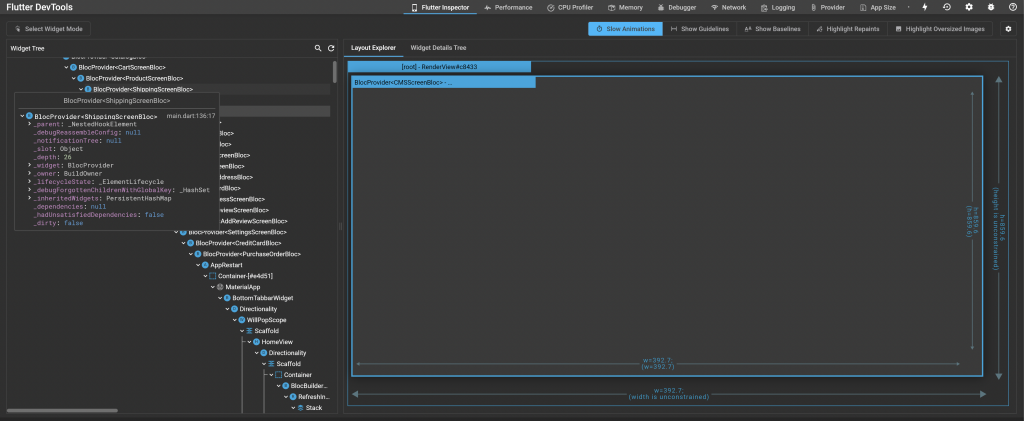
Analyze your app’s widget tree
Flutter apps are built using a tree of widgets. If your app is performing poorly, it’s possible that your widget tree is too complex or that some widgets are unnecessarily rebuilding.
You can use Flutter’s widget inspector to visualize your app’s widget tree and identify any performance bottlenecks.
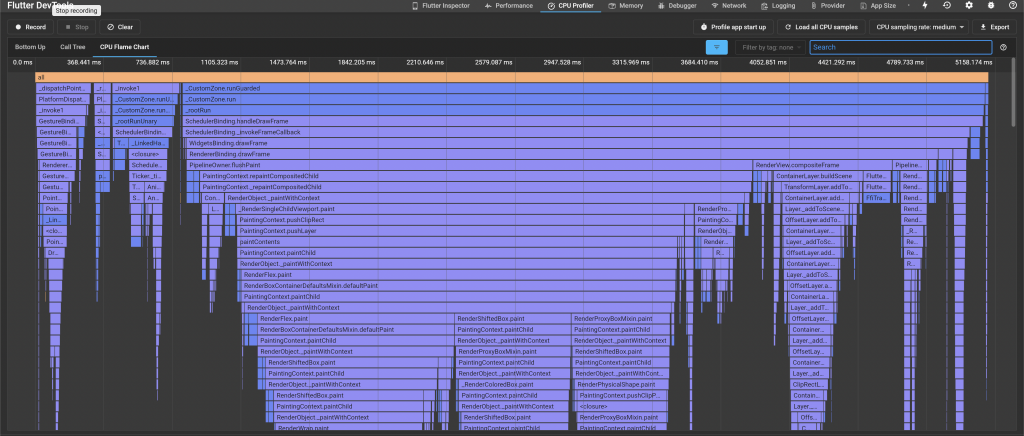
Profile your app’s code
We can use the Dart Observatory to profile your app’s code and identify performance issues.
The Observatory provides information about your app’s memory usage, CPU usage, and garbage collection.
To use the Observatory, run your app with the --observe flag and connect to it with a web browser.
For more details, you can also go through our blog on improving the performance of the flutter.
Test the app on different devices
The performance issues may only come on certain devices or configurations. So It is a good idea to test your app on a range of devices to identify any device-specific performance issues.
Optimize images and assets
The large images and assets can cause your app to load slowly and consume a lot of memory. Optimize your images and assets by compressing them and reducing their size.
Use lazy loading
If your app contains a large amount of data, consider using lazy loading to load data as needed. This can help reduce memory usage and improve the performance of your app.
Reduce network requests
Network requests can cause your app to slow down if they are not optimized.
Consider reducing the number of network requests by caching data, using background data fetching, and optimizing the size of data being transferred.
To check API Caching in Flutter, you can go through our blog.
Use background processing
A heavy computation or processing task can also cause performance bottlenecks in your app. Consider using background processing to offload these tasks from the main UI thread.

Be the first to comment.