We all know how to view the source code of any web page or inspect element and other stuff on any browser. This can be done using any browser even Internet Explorer 4 can do that. But what’s new. Just like Android Studio, Chrome is my personal favorite even though both of them combined eats up system ram heavily. Chrome is a powerful tool because of a lot of powerful Chrome apps and developer tools are available and supported.
In this blog, we are going to find out some of the cool features of using Chrome in respect to Android application debugging/inspecting.
One such feature is remote debugging Android devices via chrome developer tools.
Remote Debugging
If you knows web developement, I am sure your website contains mobile friendly web pages. But there are times when loading your site on mobile doesn’t look or behave as expected. Thus you need a developer tool for mobile as well just like chrome developer tool for website or firebug if in case you are an FireFox lover.
We can do the same for web pages loading on Android devices using Chrome application.
Remote Debugging benefits
- Testing on real device thus you can tweak the problem and fix it when your site is running on mobiles.
- Screencasting the entire page or chrome application using System remotely on your developement machine.
Requirement to enable Remote Debugging
There are some requirements to perform remote debugging smoothly viz,
- Chrome 32 or later installed on your development machine.
- USB drivers installed on your development machine if you’re using Windows. Ensure Device Manager reports the correct USB driver.
- A USB cable to connect your Android device to your development machine.
- Android 4.0 or later.
- Chrome App for Android installed on your Android device.
How to start debugging via Android device
- On your Android device, select Settings > Developer Options > Enable USB Debugging.
- On your development machine, open Chrome. You should be signed in to Chrome with one of your Google accounts. Remote debugging does not work in Incognito Mode or Guest Mode.
- Open DevTools.
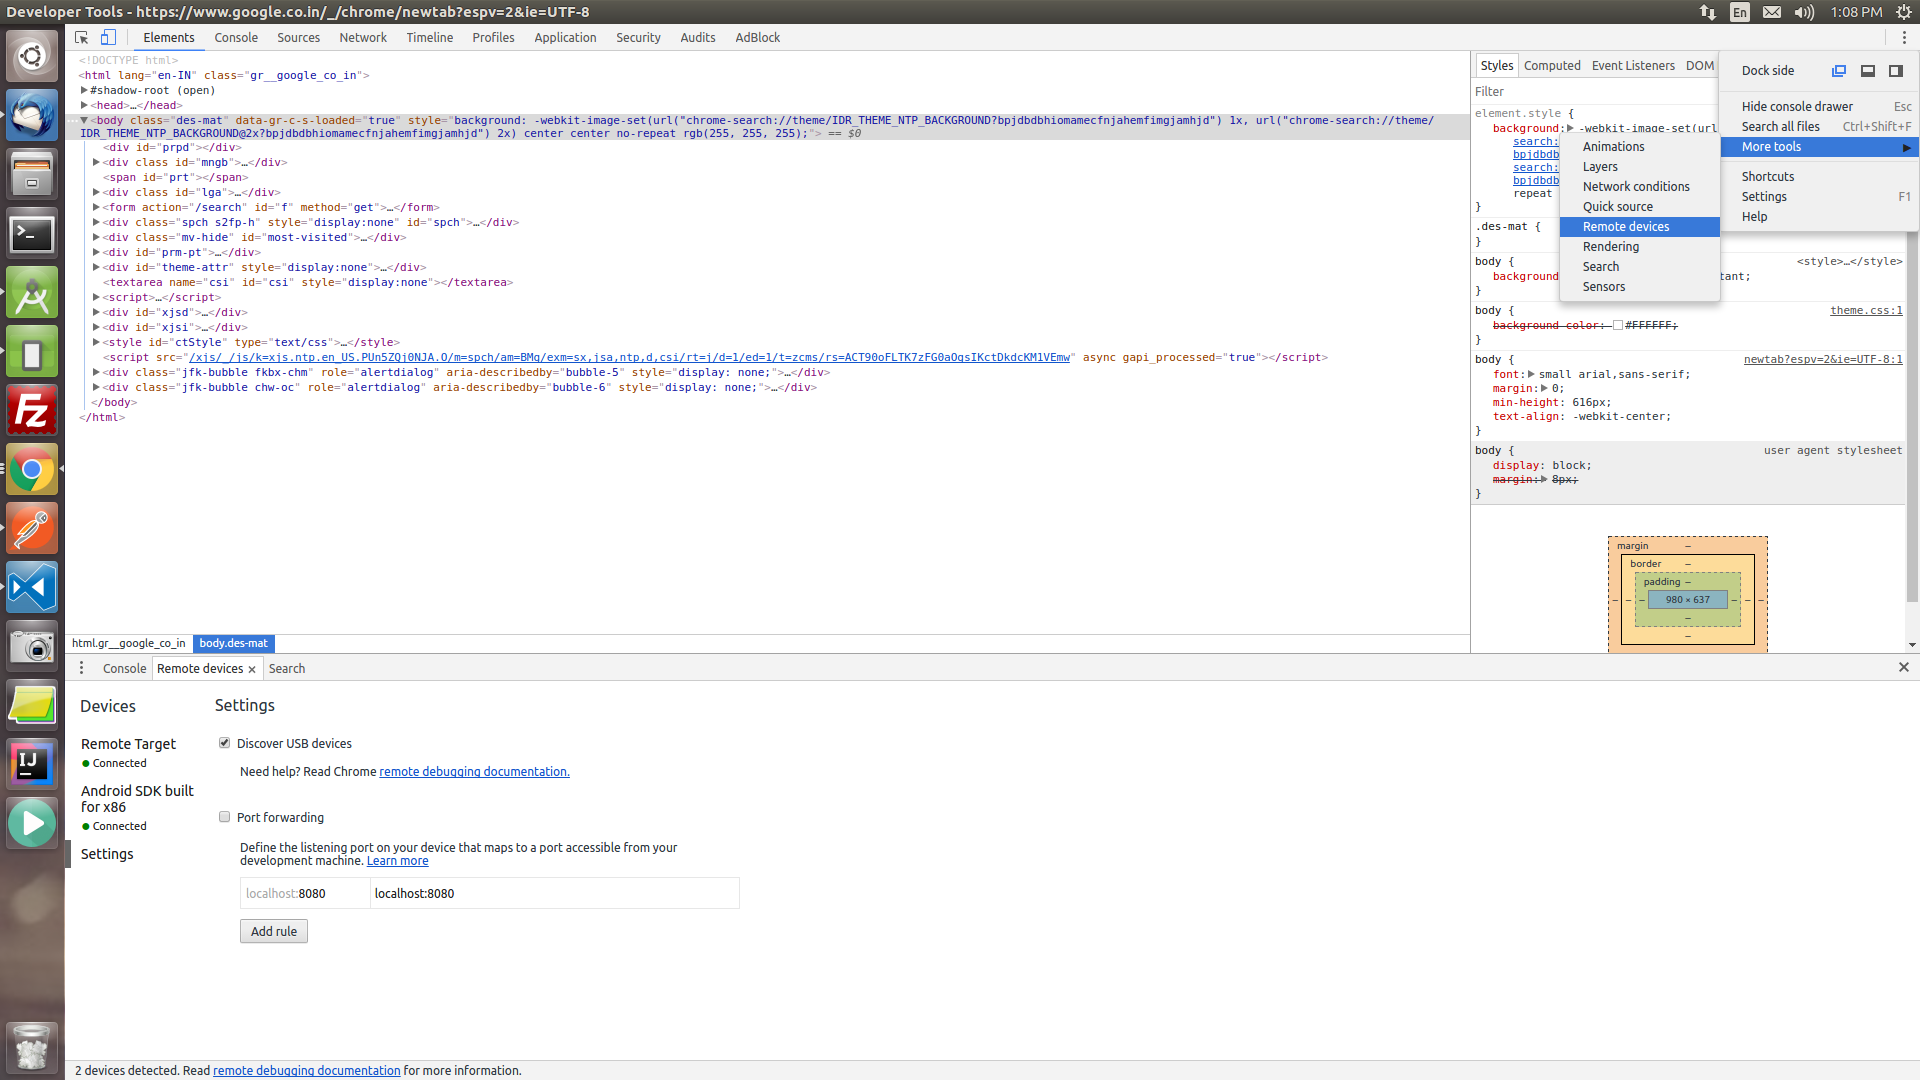
- In DevTools, click the Main Menu , then select More tools > Remote devices.

- In DevTools, click the Settings tab, if another tab is showing.
- Make sure that Discover USB devices option is enabled.
- Connect your Android device directly to your development machine using a USB cable. Don’t use any intermediate USB hubs. If this is your first time connecting your Android device to this development machine, your device shows up under Unknown, with the text Pending Authorization below it.
- If your device is showing up as Unknown, accept the Allow USB Debugging permission prompt on your Android device. Unknown is replaced with the model name of your Android device. The green circle and the Connected text indicate that you are all set to remotely debug your Android device from your development machine.
- If you don’t already have Chrome open on your Android device, open it now.
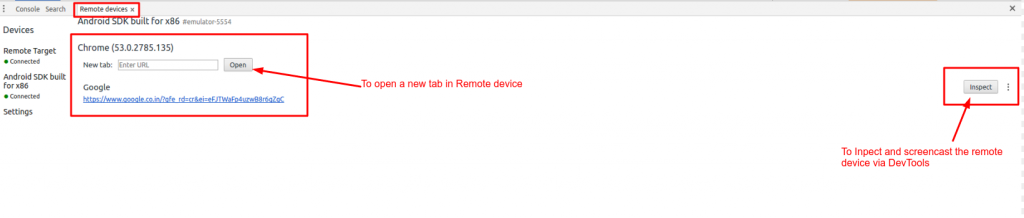
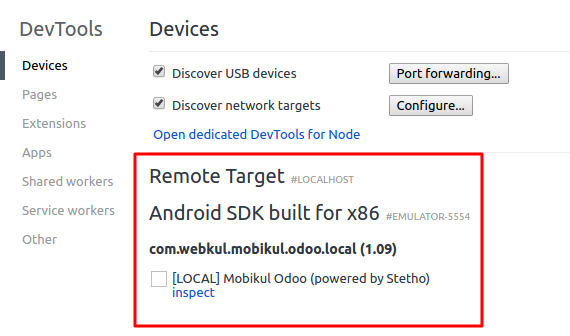
- Back in DevTools, click the tab that matches your device’s model name. At the top of this page, you see your Android device’s model name, followed by its serial number. Below that, you can see the version of Chrome that’s running on the device, with the version number in parentheses. Each open Chrome tab gets its own section. You can interact with that tab from this section. If there are any apps using WebView, you see a section for each of those apps, too. The screenshot below does not have any tabs or WebViews open.


For further reading: Click here
Facebook Stetho
Chrome Developer Tools only enable debugging for chrome app and web views. For debugging your Android application we can use debug bridge like stetho which provide access to the Chrome Developer Tools feature for your application.
Set-up
Add Stetho dependency in module level gradle
In case you are using okhttp3 network library then to log request and response we can use the following dependency:
|
1 |
compile 'com.facebook.stetho:stetho-okhttp3:1.5.0' |
For other, Check here
Update application class to initialize stetho with defaults:
|
1 2 3 4 5 6 7 |
public class MobikulApplication extends Application { @Override public void onCreate() { super.onCreate(); Stetho.initializeWithDefaults(this); // add this line } } |
Enable network inspection:
|
1 2 3 |
new OkHttpClient.Builder() .addNetworkInterceptor(new StethoInterceptor()) .build() |
On Adding stetho interceptor in your application’s okhttp client you can modify request/response and monitor it accurately. Now we are ready to inspect and debug Application.
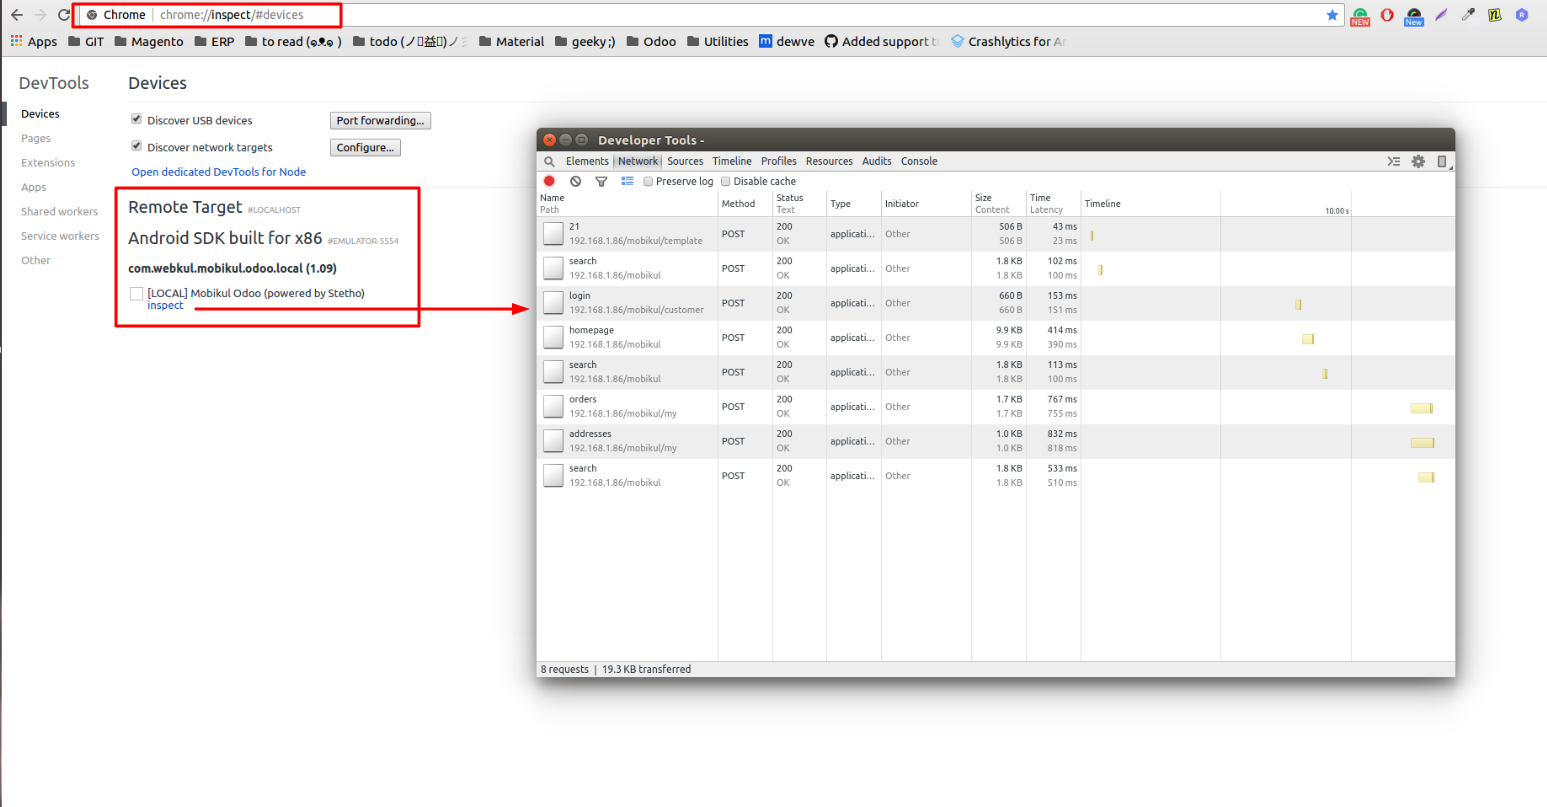
Once done with the set-up instructions, just start your app and point your development machine browser to chrome://inspect. Click the “Inspect” button to begin.


Be the first to comment.