Hello everyone in this article, we would be discussing breakpoints and debugging with LLDB in Xcode.
Every developer should know how to debug the code written by him to resolve the issues.
Apple has provided a handy tool for debugging the code in Xcode which is breakpoints.
Breakpoints along with the LLDB commands make debugging easier in the Xcode.
How to use Breakpoints and LLDB in Xcode
LLDB is a debugging component used in the LLVM project which was developed by the LLVM developer group.
Xcode uses the LLDB as the default debugging tool. The full form of LLDB is Low-level debugger.
Breakpoints help a developer to stop the execution of the program at any point. Stopping the execution of the program at any point helps to know the current state of that program and its properties.
In addition, there are several types of breakpoints which is used in the Xcode to simplify the debugging.
Working of breakpoints
Let’s know how to create a breakpoint in the code.
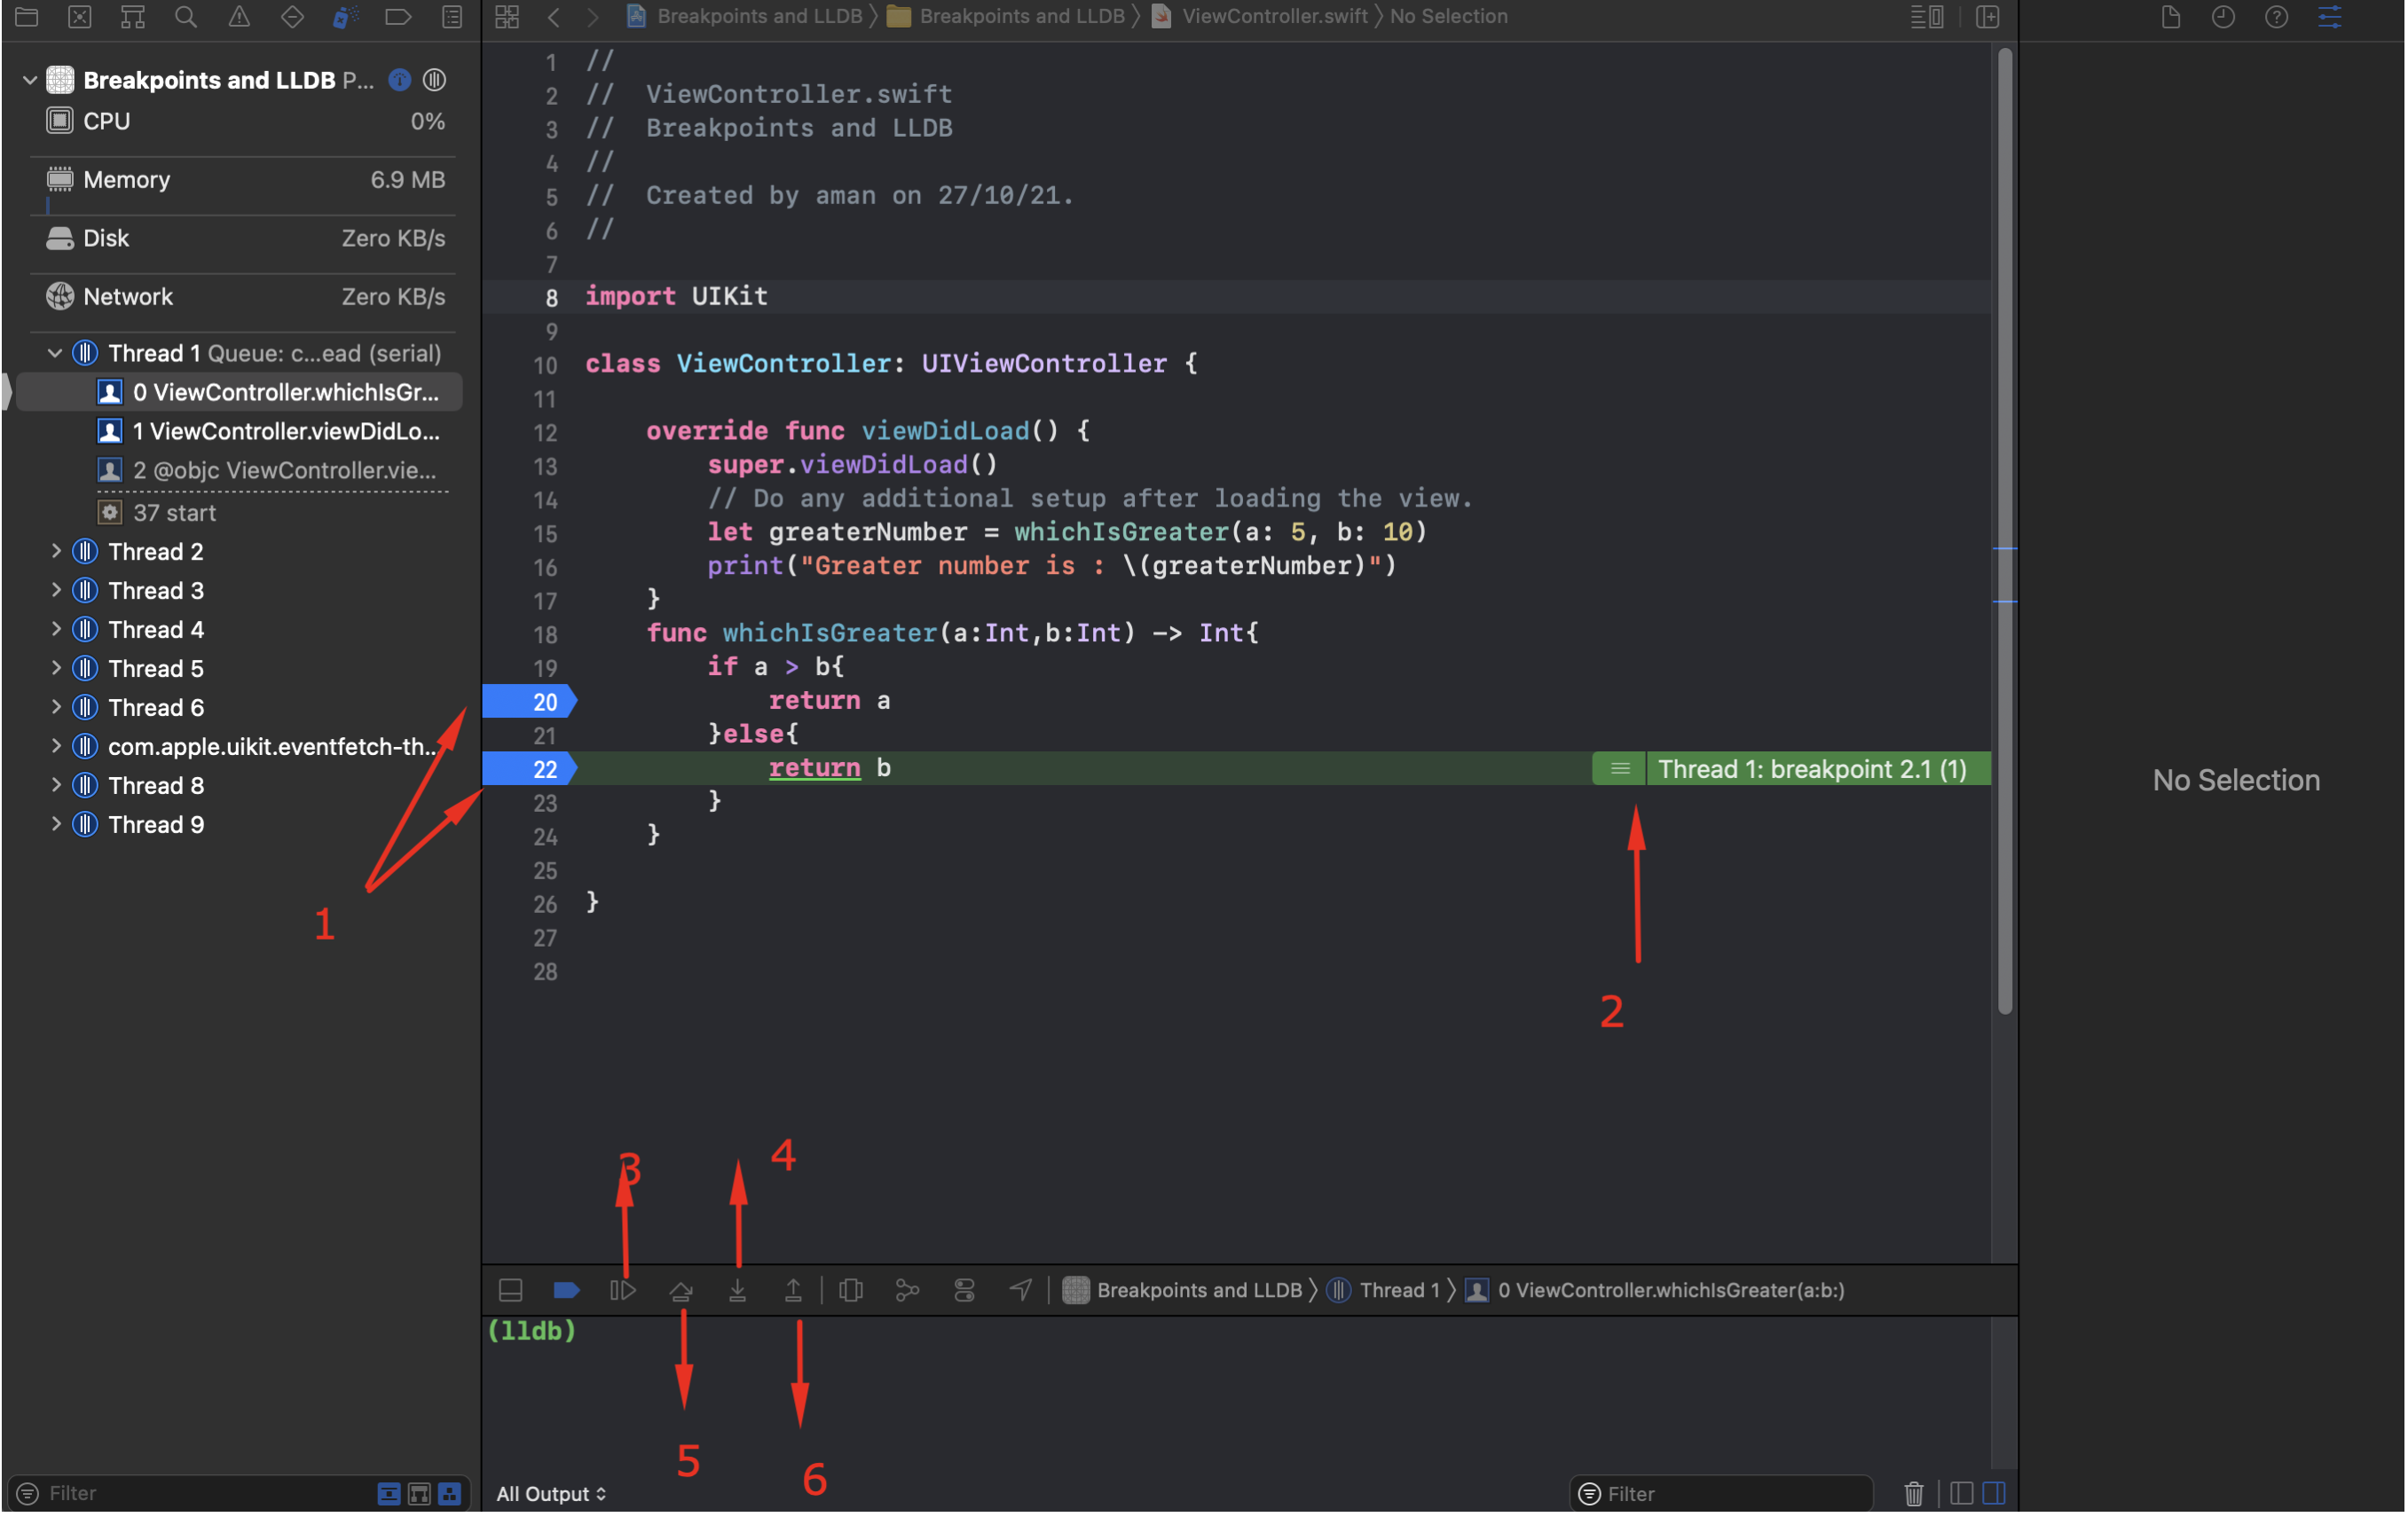
- Create a breakpoint by clicking over the line number where you want to stops the executuion of the program. The code will evaluate the condition and will stop where it mets the condition.
- It creates a thread for the breakpoint. In other words,the program will remain at this point untill you release the breakpoint.
- Using this button we let the debugger to continue the execution of the code.
- Using Step over button lets us to execute the next line of code.
- The Step in button allows the execution of the program to go inside the function to examine the functionality.
- The Step out jumps out of a function.
When we click the continue button we get the result printed on the console.
You can also use the LLDB command, for instance, type “c” at the console after the text “lldb” and hit enter, this will make the execution of the program continue.
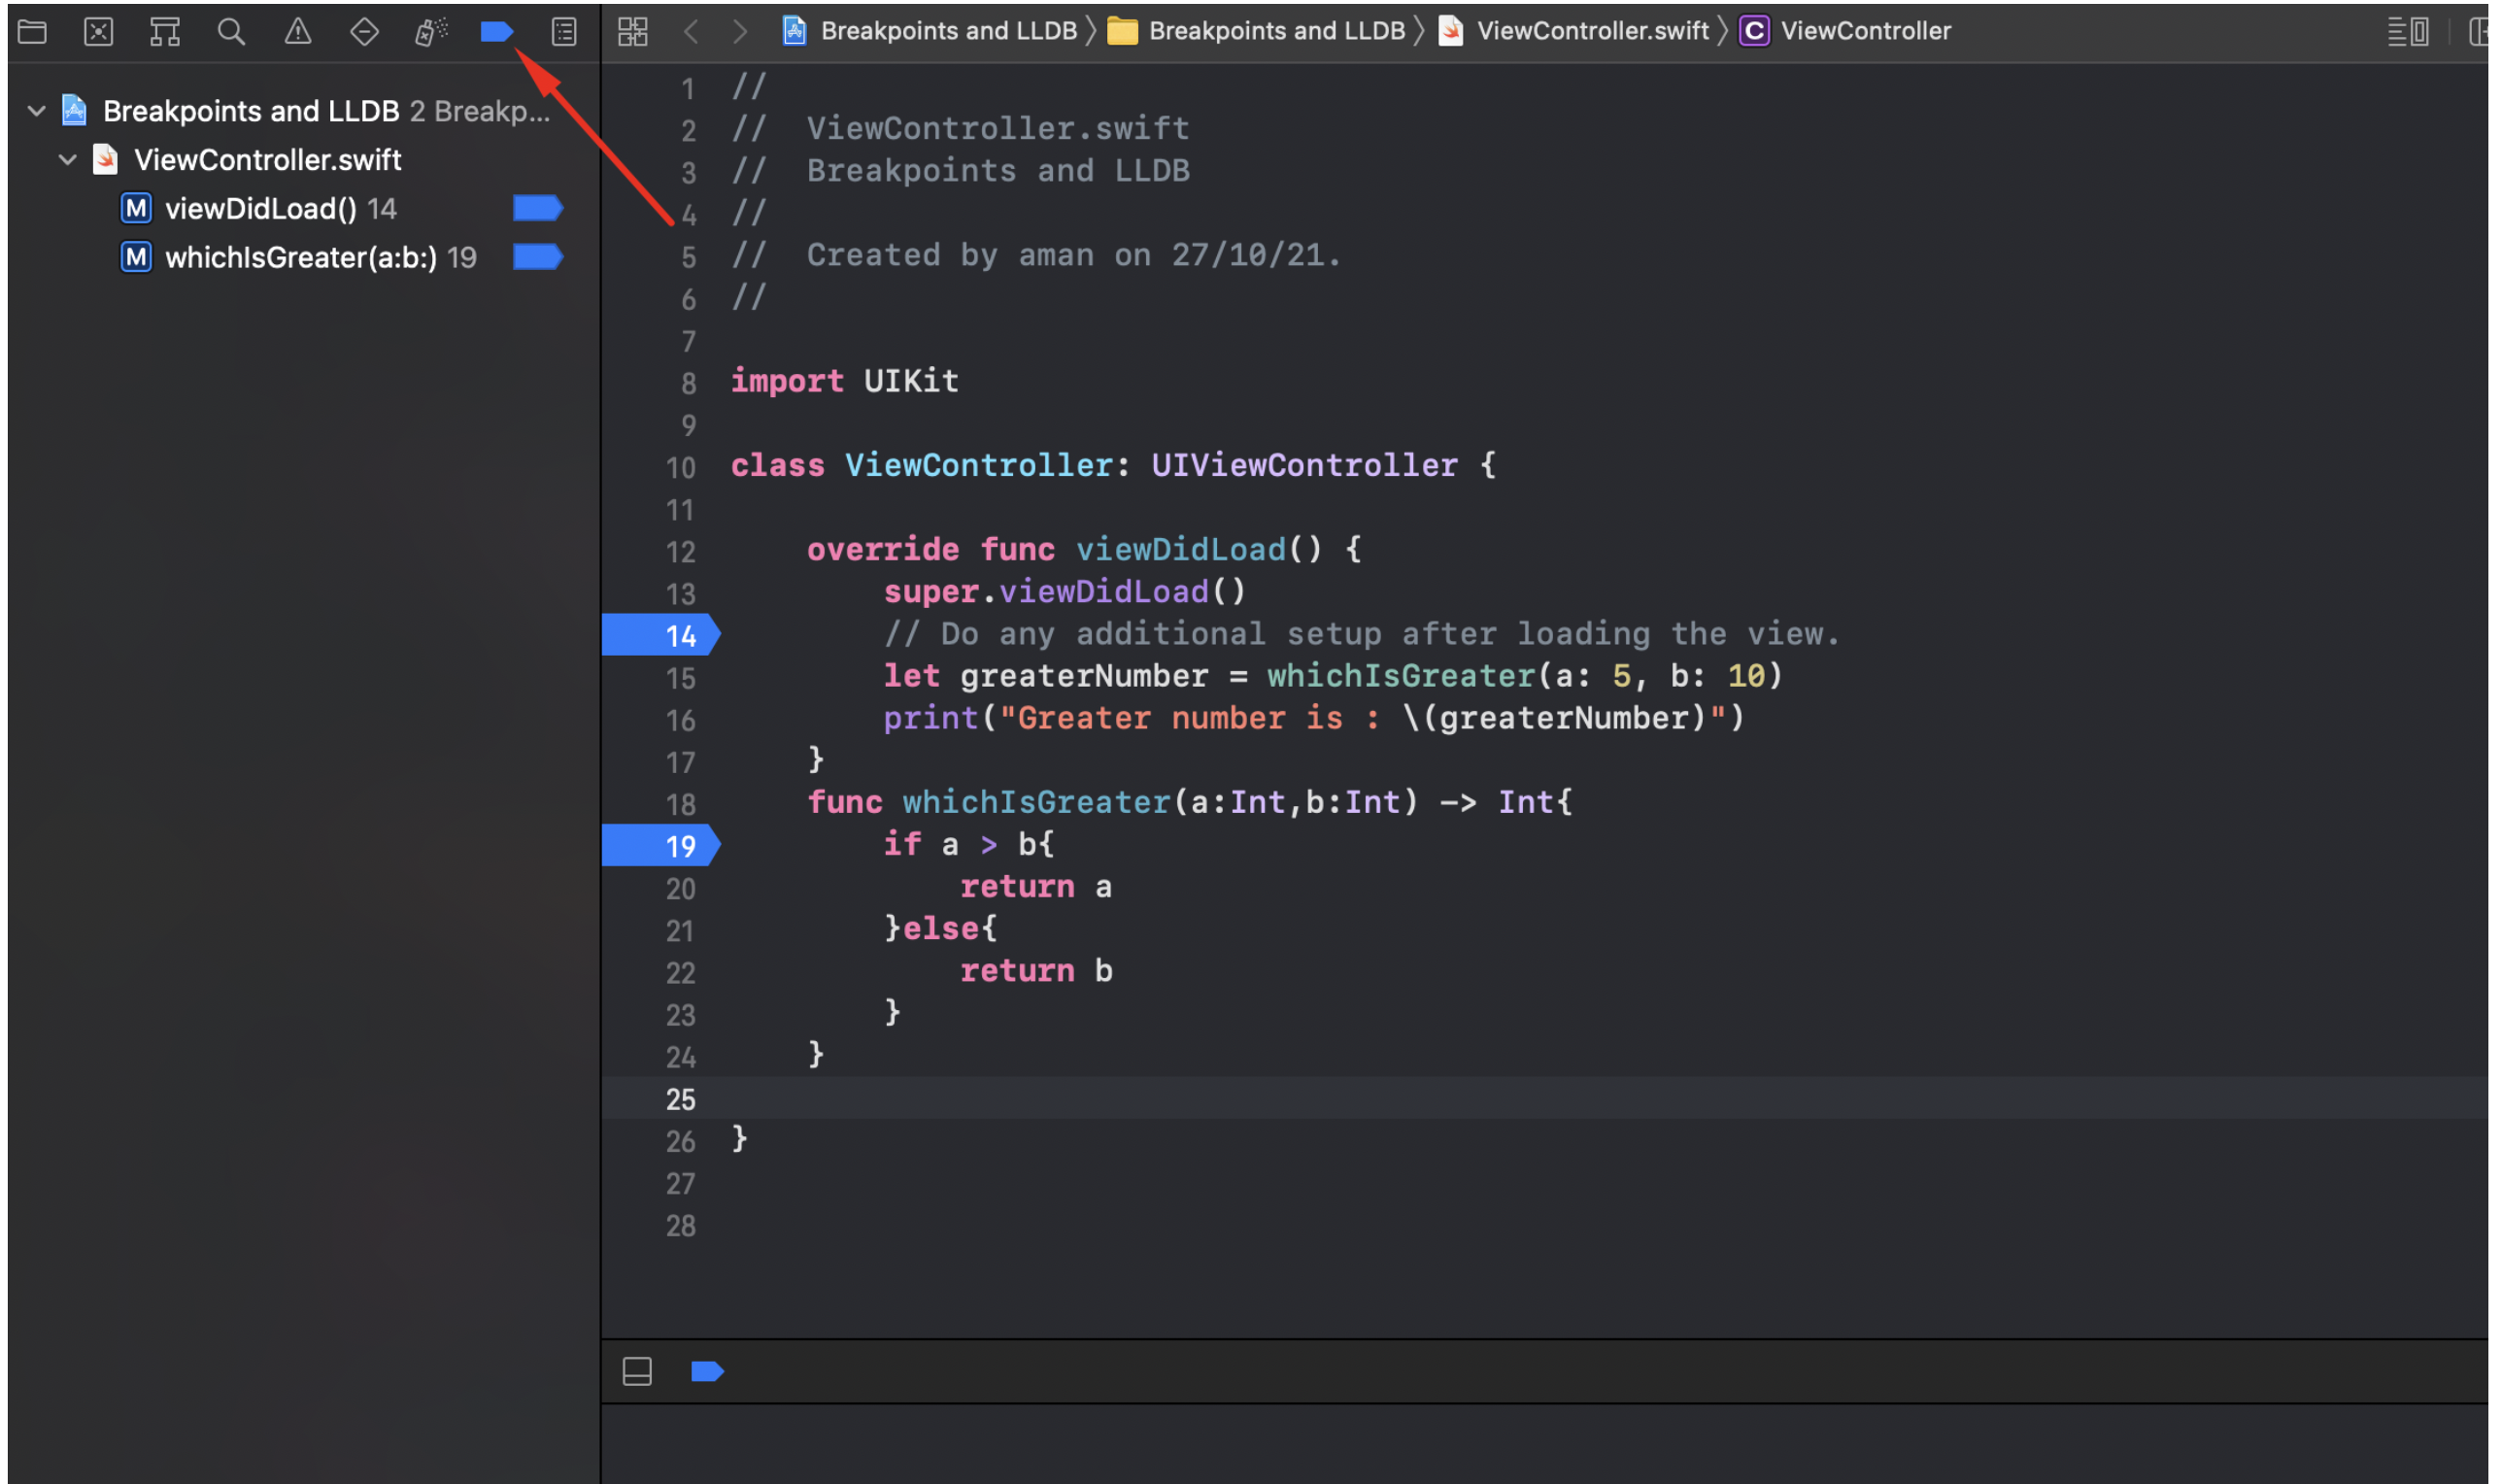
By clicking on the breakpoint panel you will see the list of all breakpoints in your project.
We can also edit the breakpoints by right-clicking on the breakpoint and selecting the Edit breakpoint as shown in the below image.
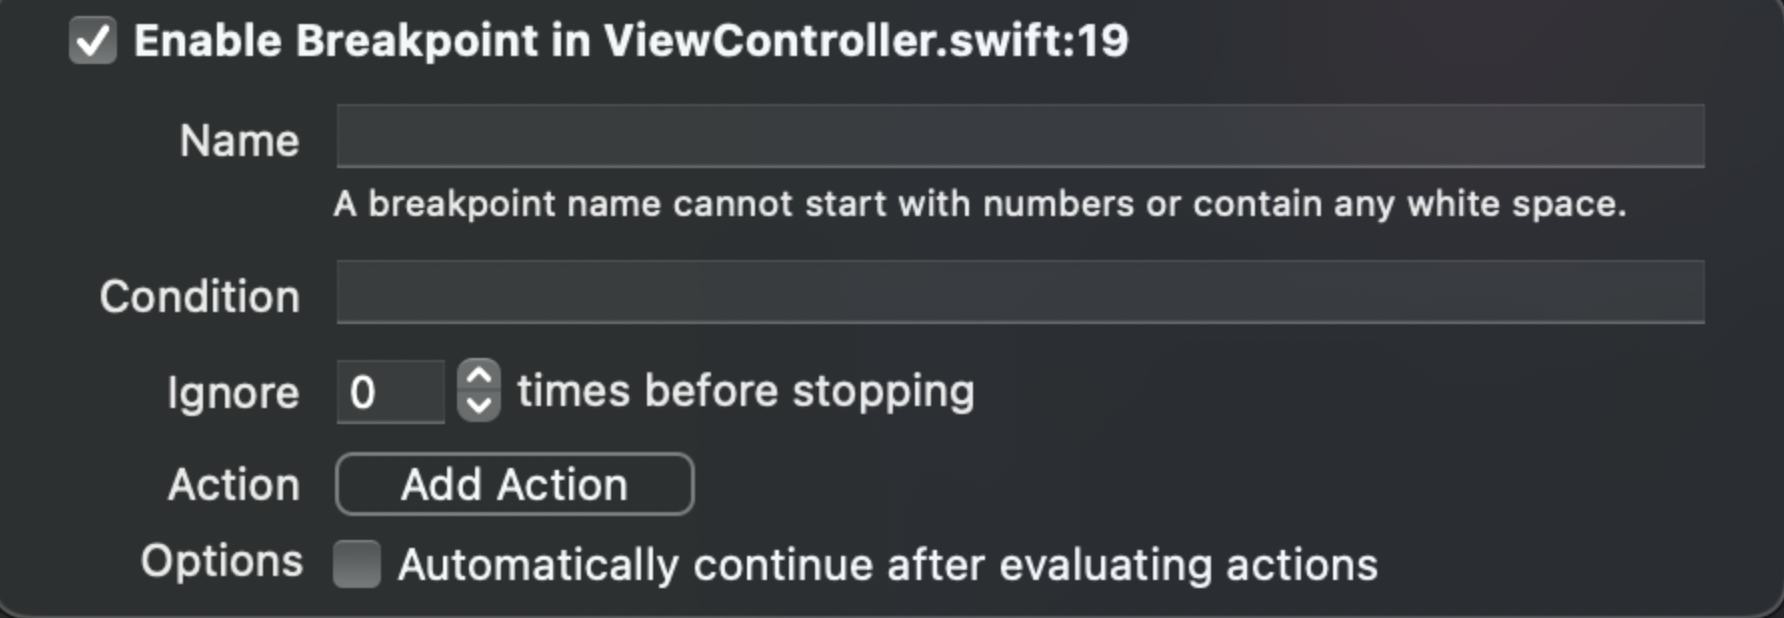
Here is what the above fields do.
- Condition : The breakpoint will only execute if the provided condition is satisfied.
- Ignore : If you give the value to ignore it will ignore the execution till the provided value.
- Action : Action that is executed after the breakpoint breaks, usually print the value of the variable or anything.
- Options : Automatically continue after evaluating actions.
This is the basic working of the breakpoint however, we can do a lot with the breakpoints.
LLDB commands
Here are a few LLDB commands for the breakpoint thread.
a.) (lldb) thread step-over
OR
(lldb) next
OR
(lldb) n
b.) (lldb) thread step-in
OR
(lldb) step
OR
(lldb) s
c.) To see the active threads
(lldb) thread list
We can examine any variable and expression in the runtime, here are some LLDB commands.
a.) To print the variable just type
e <variable>
b.) To evaluate the expression, just type
e <expression>
We can also change the value of the variable at the runtime to observe the output with different values.
a.) e <variable> = <any value>
the variable’s value will be the same as provided till the end of the debugging.
A very basic command is used to print the value of any variables in the console which is
a.) po <variable name>
We can do a lot with the LLDB commands, here are some additional commands.
(lldb) breakpoint enable
Enables the breakpoint
(lldb) breakpoint disable
Disables the breakpoint
(lldb) breakpoint delete
Deletes the breakpoint
(lldb) breakpoint set -f <file name with extension> -l <line number>
Adds the breakpoint at the given line number on the given file.
Conclusion
In this article, we have just described the very basic working of the breakpoints and LLDB commands.
We recommend you to open the terminal and enable LLDB and type help, you will get the documentation.
For more please refer to :
https://developer.apple.com/videos/wwdc2014
Hope you would like my article.

Be the first to comment.