The Android Studio Debugger allows us to monitor our application in real time, and can provide additional insight regarding a connected device or emulator.
Importance
Without writing extra code in our program, we can use it as hit and try method to conclude the range of values at run time.
We can save our time to check result of every operation which is performed on a particular variable or group of variables.
It is also useful to check flow of our code.
Breakpoints
In order to pause the code at a given location, we need to add something called a breakpoint. A breakpoint is a language-agnostic term meaning the location at which code is intentionally paused.
Placing Breakpoints
Just simply click on the space between lift side of code and line number, a red-dot will appear which is called break-point.
You can check break-point in below image also :
Hitting Breakpoints
You can start debugging in 2 ways:
Run your app in debug mode.
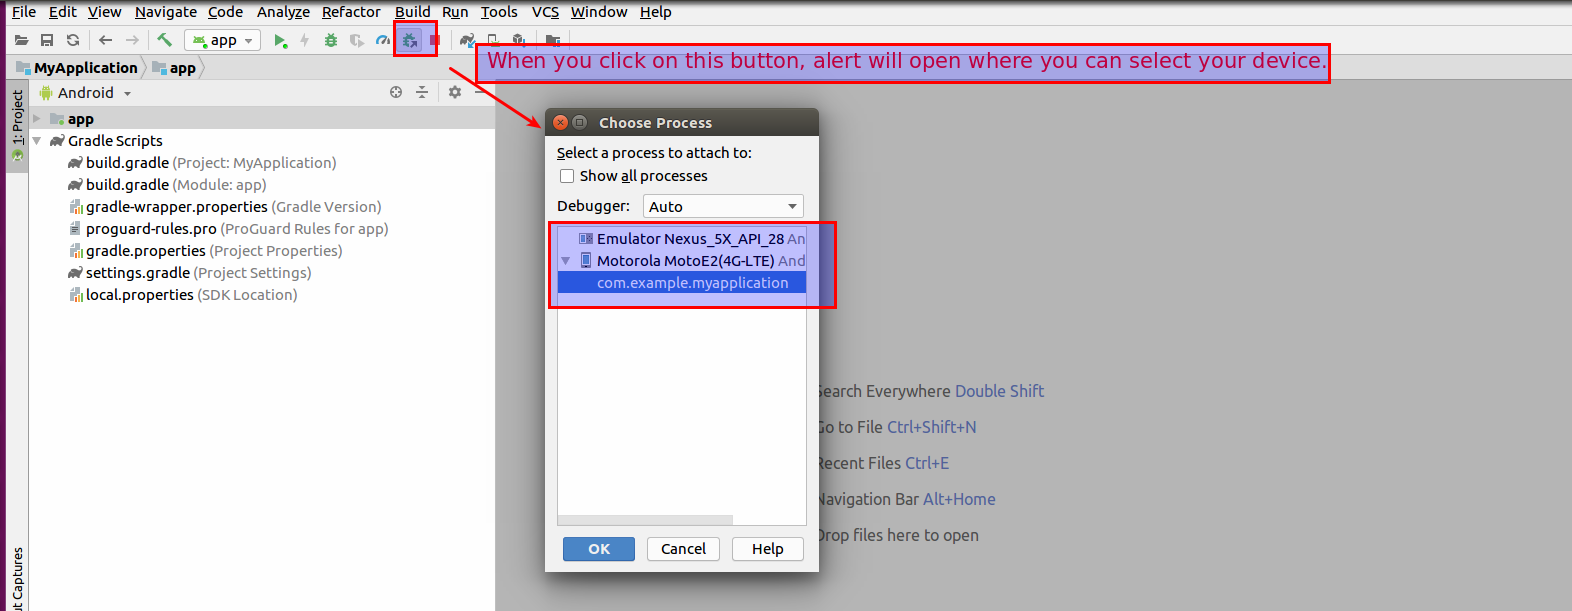
Start debugging at any point in app. Add break-point in code, click on debug button and select device.
Evaluate Value
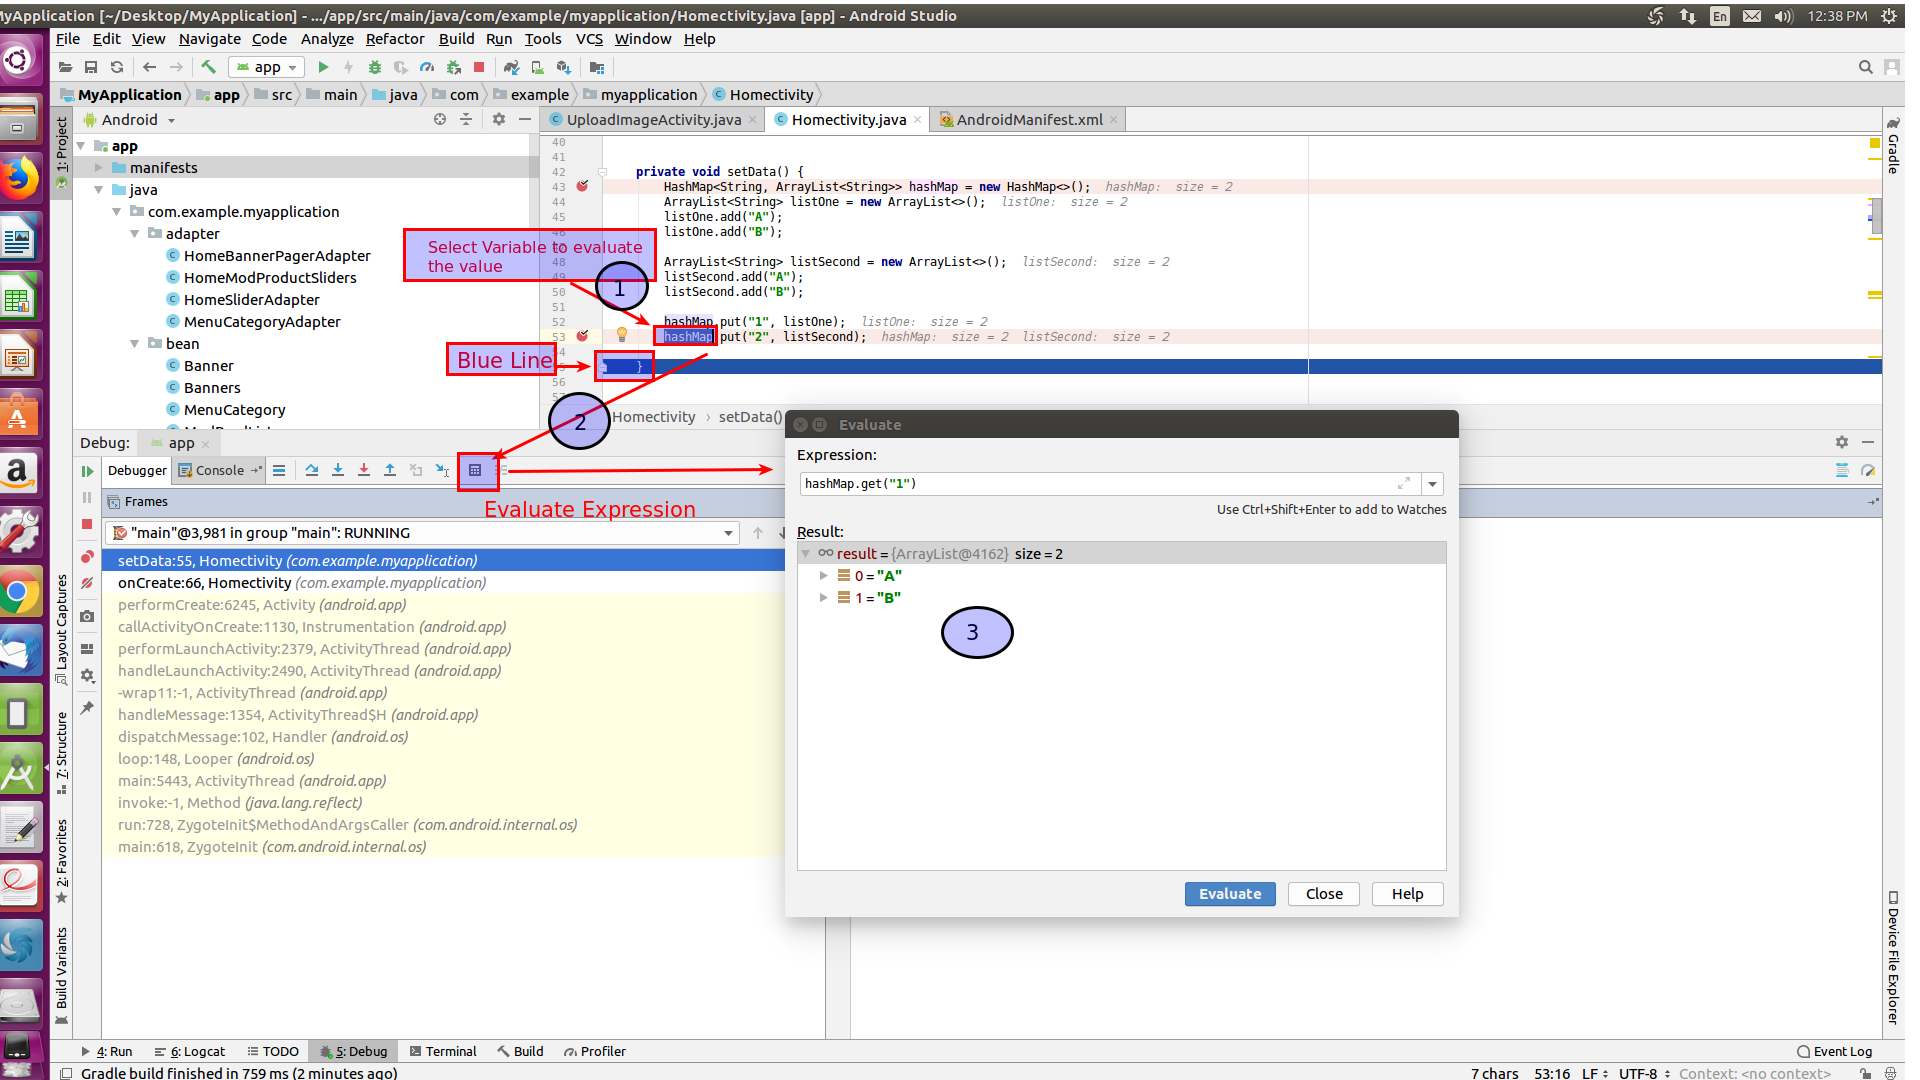
Blue Line -> It shows on which line we have controller of program.
To evaluate value ->
- Select variable you want to evaluate.
- Click on Evaluate Expression Button
- Popup window will open, where you can see your select expression or variable and perform any operation on it.
Evaluate Range Of Values at run-time
Now, we can evaluate range of values of used hashmap variable at run-time.
Example: Please see below images to see range of values or how to perform operations on selected variable and it’s result.
Here, we are getting list inside hashmap key “1”.
As, hashmap does not contain key “5”, so we are getting result null.
As, list inside hashmap key “1” having not value at index 3, so we getting error.
Flow Of Code
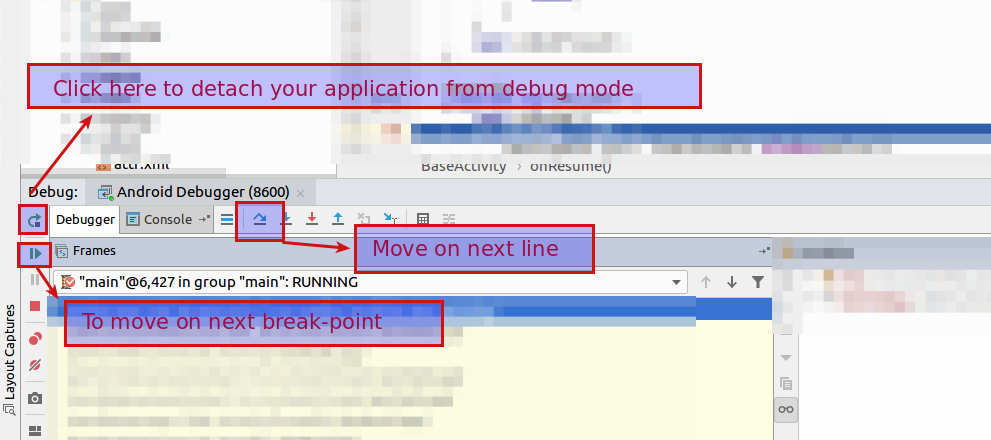
Break-point pause the execution of code of further lines.


Be the first to comment.